Market Outlook
May 19, 2017
Market Cues
Domestic Indices
Chg (%)
(Pts)
(Close)
Indian markets are likely to open flat tracking the SGX Nifty and Global markets.
BSE Sensex
(0.7)
(224)
30,435
After a sharp fall the day before the US markets saw some rebound on Thursday as
Nifty
(1.0)
(96)
9,429
bargain buying helped in strength in the index. Though there were still some
Mid Cap
(2.2)
(326)
14,751
volatility in the markets and most of the indices opened on a nervous note, major
Small Cap
(2.0)
(319)
15,362
averages ended the day firmly in positive territory. It seems traders may have felt
yesterdays sell off was overdone. The rebound in the US markets also came
Bankex
(1.3)
(326)
25,758
following the release of some upbeat economic data, including a report from the
Labor Department showing another unexpected drop in initial jobless claims in the
Global Indices
Chg (%)
(Pts)
(Close)
week ended May 13th.
Dow Jones
0.3
157
20,663
The European markets declined in the early trades during the day but subsequently
Nasdaq
0.7
44
6,055
recovered on the back of positive cues from the Wall Street and ended with minor
FTSE
(0.9)
(67)
7,436
losses for the day.
Nikkei
(1.3)
(261)
19,554
Indian markets witnessed sharp selling on Thursday amid pressure in the Global
Hang Seng
(0.6)
(157)
25,137
markets. The uncertainty surrounding U.S President Donald Trump after firing of FBI
Shanghai Com
(0.5)
(14)
3,090
Director raised concern among investors since then we have seen high volatility in
the major global indices and the trend might continue for some time. Back home,
Advances / Declines
BSE
NSE
the GST council has approved and passed the various tax rates to applicable for
sector and since 81% of the goods are likely to be taxed at 18% or below has come
Advances
1,678
1,312
as a comfort and markets might take it in a positive note.
Declines
2,078
1369
Unchanged
168
84
News Analysis
GST Council passes rates for majority of goods and services
Volumes (` Cr)
Bank Of Baroda post improved set of results for 4QFY17
Detailed analysis on Pg2
BSE
4,311
NSE
28,180
Investor’s Ready Reckoner
Key Domestic & Global Indicators
#Net Inflows (` Cr)
Net
Mtd
Ytd
Stock Watch: Latest investment recommendations on 150+ stocks
FII
(1,163
( 4,911
46,923
Refer Pg6 onwards
MFs
8230
2,591
23,273
Top Picks
CMP
Target
Upside
Company
Sector
Rating
Top Gainers
Price (`)
Chg (%)
(`)
(`)
(%)
Blue Star
Capital Goods
Buy
648
760
17.2
Jpassociat
113
4.4
Dewan Housing Fin. Financials
Buy
418
520
24.4
Wipro
524
3.5
Mahindra Lifespace Real Estate
Buy
444
522
17.6
Cumminsind
1,053
3.5
Navkar Corporation Others
Accumulate
231
265
14.8
Tcs
2,534
3.4
KEI Industries
Capital Goods
Accumulate
220
239
8.4
More Top Picks on Pg4
Hindcopper
69
2.8
Key Upcoming Events
Top Losers
Price (`)
Chg (%)
Previous
Consensus
Date
Region
Event Description
Reading
Expectations
Cesc
830
(15.1)
May 19, 2017 Euro Zone Euro-Zone Consumer Confidence
(3.60)
(3.00)
Idbi
70
(7.8)
May 23, 2017 US
New home sales
621.00
620.00
Jswsteel
191
(7.4)
May 23, 2017 Germany GDP nsa (YoY)
2.90
Jklakshmi
478
(7.2)
May 24, 2017 Germany PMI Services
55.40
Bharatfin
726
(6.9)
May 24, 2017 UK
GDP (YoY)
2.10
#As on May 18, 2017
May 24, 2017 Germany PMI Manufacturing
58.20
More Events on Pg5
Market Outlook
May 19, 2017
News Analysis
GST Council sets rates for goods & services tax to be
implemented from 1st July
The path for roll out of the Goods and Services Tax (GST) from July 1, 2017 has
become smoother now with the GST council clearing the tax rates. Accordingly all
services will be taxed at 12% and 18% while goods will be taxed at five different
slabs of 5%, 12%,18%,28% and 28% plus.
While earlier there was an apprehension that the in the initial years the
implementation of GST will be inflationary, the Finance Minister has said that
impact of GST will not be inflationary, rather in some instance prices are likely to
drop. The fact that several daily use items such as milk, fruits, vegetables and
cereals & food grains will be exempted from all tax makes us believe that in fact
inflation may not be an issue post implementation of GST. During the meeting
tariff on about 1211 items were finalized and it was decided that nearly 81% of
the items will fall under the 18% GST slab and only 19% of the goods to be taxed
above 18% rate. Giving a boss to the heavy capex related industry the council has
set the rate for capital goods, industrial intermediate items at 18%. Further in
another key development it has been said that Coal will be taxed at 5% against the
current rate of 11.69%, this should not only help the power producers which are
reeling under pressure, but also to host of industry which are dependent on it
either in the form of supplying goods or services. Luxury cars will attract a rate of
28%, plus 15% cess, while small petrol cars will attract 28% tax in addition to 1%
cuss. Diesel small cars will carry a tax of 28% along with 3% cess. However, there
are some sectors like consumer durables which will attract a lower tax rate of 28%
compared to existing 28%, benefiting both the industry and end users.
Bank of Baroda posts improved set of results for 4QFY17
BoB has come out with a good set of results for the quarter. While the reported
PAT numbers has been below our expectations, there is an improvement of NPAs
which is a positive development. GNPAs have come down to 10.46% vs 11.40%
while NNPAs has come down to 4.72% vs 5.43%. During the quarter the bank has
taken higher provisions QoQ, but there has been an improvement in the PCR also
from 64.5% to 66.8% and this should take in a positive note. Slippages of `4,077
cr remained under control and this is directionally positive for the improvement in
the asset quality for the bank. Standard restructured loan book has fallen to
`10,785cr vs `14,059cr. Overall business growth continues to be sluggish for the
bank with loan book remaining flat YoY. However, on QoQ basis the loan book
has grown by 9.5%.The bank continued to downsize its overseas loan book, while
the domestic loan book saw decent growth during the quarter. However, we have
a cautious call on the PSU space and NEUTRAL rating on the stock.
Market Outlook
May 19, 2017
Economic and Political News
Income Tax department publishes defaulters owing over `10cr
IT industry lay off numbers exaggerated says , NASSCOM
Domestic air passenger grow by 15.2% in April 2017
Volvo to start assembling cars in India by year end
Corporate News
IDBI Bank’s Q4FY17 loss widens to `3,199cr, asset quality worsens
CESE has announced restructuring of business by splitting into four companies
Bajaj Auto’s Q4FY17 PAT dips to `802cr
Axis Bank cuts home loans rates by 30 bps to 8.35% for loans up to `30lakhs
Market Outlook
May 19, 2017
Quarterly Bloomberg Brokers Consensus Estimate
Tata Power Co Ltd Consol - May 19, 2017
Particulars ( ` cr)
4QFY17E
4QFY16
y-o-y (%)
3QFY17
q-o-q (%)
Net sales
7,135
9,375
(23.9)
6,678
6.8
EBITDA
1,620
1,913
(15.3)
1,403
15.5
EBITDA margin (%)
22.7
20.4
21.0
Net profit
476
360
32.3
599
(20.5)
Grasim Industries Ltd Consol - May 19, 2017
Particulars ( ` cr)
4QFY17E
4QFY16
y-o-y (%)
3QFY17
q-o-q (%)
Net sales
10,152
9,896
2.6
8,495
19.5
EBITDA
531
2,002
(73.5)
1,712
(69.0)
EBITDA margin (%)
5.2
20.2
20.1
Net profit
849
696
21.9
728
16.5
Motherson Sumi Systems Consol - May 19, 2017
Particulars ( ` cr)
4QFY17E
4QFY16
y-o-y (%)
3QFY17
q-o-q (%)
Net sales
11,137
10,068
10.6
10,514
5.9
EBITDA
1,235
1,064
16.1
1,075
14.9
EBITDA margin (%)
11.1
10.6
10.2
Net profit
462
414
11.6
416
11.0
Union Bank of India - May 19, 2017
Particulars ( ` cr)
4QFY17E
4QFY16
y-o-y (%)
3QFY17
q-o-q (%)
Net profit
134
96
39.6
104
29.0
State Bank of India - May 19, 2017
Particulars ( ` cr)
4QFY17E
4QFY16
y-o-y (%)
3QFY17
q-o-q (%)
Net profit
2392
1260
89.8
2152
11.2
Market Outlook
May 19, 2017
Top Picks ★★★★★
Market Cap
CMP
Target
Upside
Company
Rationale
(` Cr)
(`)
(`)
(%)
Strong growth in domestic business due to its leadership
in acute therapeutic segment. Alkem expects to launch
Alkem Laboratories
22,959
1,920
2,257
17.5
more products in USA, which bodes for its international
business.
We expect the company would report strong profitability
Asian Granito
1,135
377
405
7.4
owing to better product mix, higher B2C sales and
amalgamation synergy..
Favourable outlook for the AC industry to augur well for
Cooling products business which is out pacing the market
Blue Star
6,198
648
760
17.2
growth. EMPPAC division's profitability to improve once
operating environment turns around..
With a focus on the low and medium income (LMI)
consumer segment, the company has increased its
Dewan Housing Finance
13,088
418
520
24.4
presence in tier-II & III cities where the growth opportunity
is immense.
Strong loan growth backed by diversified loan portfolio
and adequate CAR. ROE & ROA likely to remain decent
Equitas Holdings
5,459
162
235
45.4
as risk of dilution remains low. Attractive valuations
considering growth.
Economic recovery to have favourable impact on
advertising & circulation revenue growth. Further, the
Jagran Prakashan
6,100
187
225
20.6
acquisition of a radio business (Radio City) would also
boost the company's revenue growth.
High order book execution in EPC segment, rising B2C
KEI Industries
1,712
220
239
8.4
sales and higher exports to boost the revenues and
profitability
Speedier execution and speedier sales, strong revenue
Mahindra Lifespace
2,278
444
522
17.6
visibilty in short-to-long run, attractive valuations
Massive capacity expansion along with rail advantage at
Navkar Corporation
3,293
231
265
14.8
ICD as well CFS augurs well for the company
Strong brands and distribution network would boost
Siyaram Silk Mills
1,667
1,779
1,872
5.3
growth going ahead. Stock currently trades at an
inexpensive valuation.
Market leadership in Hindi news genre and no.
2
viewership ranking in English news genre, exit from the
TV Today Network
1,586
266
344
29.4
radio business, and anticipated growth in ad spends by
corporates to benefit the stock.
Source: Company, Angel Research
Market Outlook
May 19, 2017
Key Upcoming Events
Result Calendar
Date
Company
Motherson Sumi, KEC International, HT Media, Electrosteel Castings, Abbott India, MM Forging, Elecon Engineering,
May 19, 2017
GSK Pharma, Tata Power Co., VRL Logistics
May 20, 2017
Corporation Bank
Source: Bloomberg, Angel Research
Global economic events release calendar
Bloomberg Data
Date
Time
Country
Event Description
Unit
Period
Last Reported
Estimated
May 19, 2017
7:30 PMEuro Zone
Euro-Zone Consumer Confidence
Value
May A
(3.60)
(3.00)
May 23, 2017
7:30 PMUS
New home sales
Thousands
Apr
621.00
620.00
11:30 AMGermany
GDP nsa (YoY)
% Change
1Q F
2.90
May 24, 2017
1:00 PMGermany
PMI Services
Value
May P
55.40
2:00 PMUK
GDP (YoY)
% Change
1Q P
2.10
1:00 PMGermany
PMI Manufacturing
Value
May P
58.20
May 25, 2017
7:30 PMUS
Existing home sales
Million
Apr
5.71
5.67
May 26, 2017
6:00 PMUS
GDP Qoq (Annualised)
% Change
1Q S
0.70
0.90
May 30, 2017
7:30 PMUS
Consumer Confidence
S.A./ 1985=100
May
120.30
May 31, 2017
1:25 PMGermany
Unemployment change (000's)
Thousands
May
(15.00)
6:30 AMChina
PMI Manufacturing
Value
May
51.20
Jun 01, 2017
2:00 PMUK
PMI Manufacturing
Value
May
57.30
Jun 02, 2017
6:00 PMUS
Change in Nonfarm payrolls
Thousands
May
211.00
175.00
6:00 PMUS
Unnemployment rate
%
May
4.40
Jun 07, 2017
2:30 PMEuro Zone
Euro-Zone GDP s.a. (QoQ)
% Change
1Q F
0.50
2:30 PMIndia
RBI Reverse Repo rate
%
Jun 7
6.00
2:30 PMIndia
RBI Cash Reserve ratio
%
Jun 7
4.00
2:30 PMIndia
RBI Repo rate
%
Jun 7
6.25
Jun 08, 2017
China
Exports YoY%
% Change
May
8.00
5:15 PMEuro Zone
ECB announces interest rates
%
Jun 8
-
Jun 09, 2017
India
Imports YoY%
% Change
May
49.10
India
Exports YoY%
% Change
May
19.80
Source: Bloomberg, Angel Research
Market Outlook
May 19, 2017
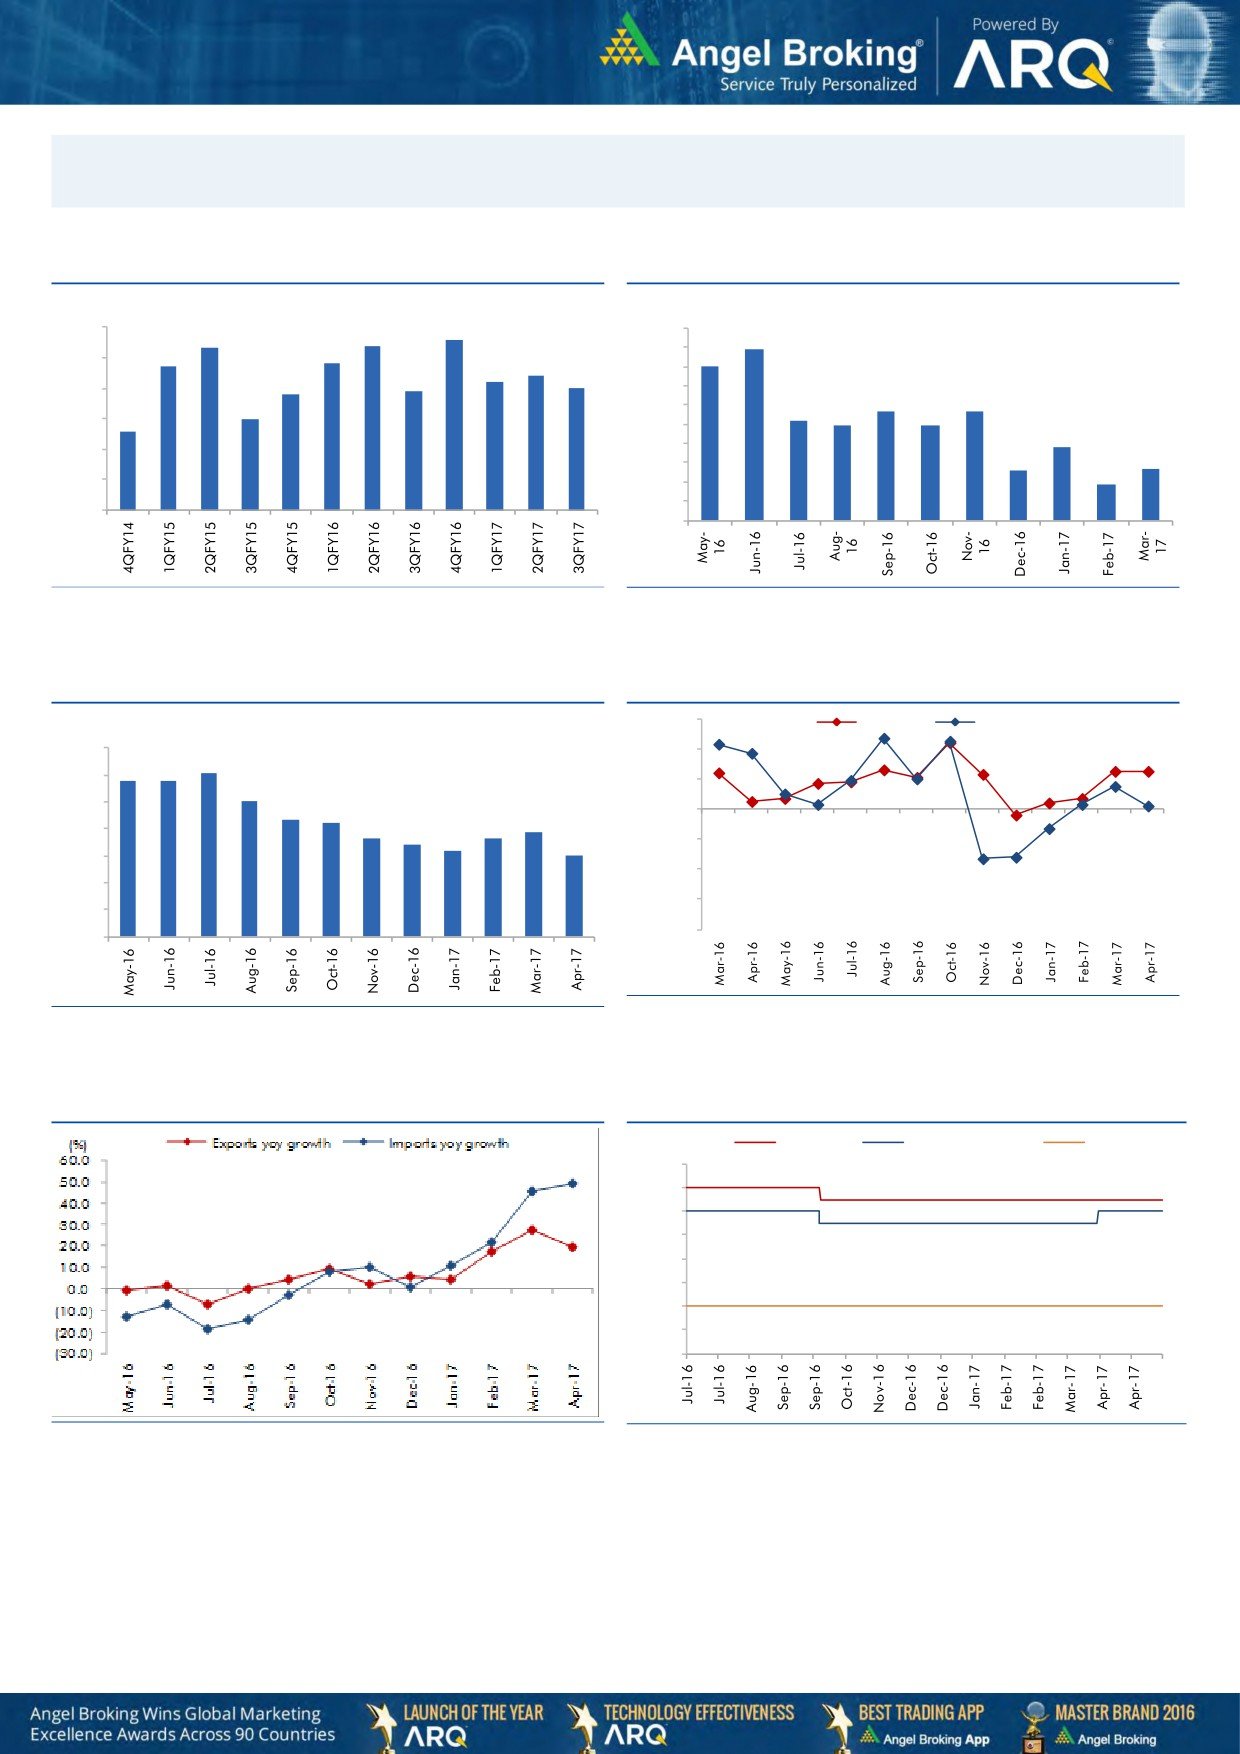
Macro watch
Exhibit 1: Quarterly GDP trends
Exhibit 2: IIP trends
(%)
(%)
8.6
9.0
8.3
8.4
10.0
8.9
7.7
7.8
9.0
8.0
8.0
7.4
7.2
8.0
6.9
7.0
6.8
7.0
7.0
5.7
5.7
6.0
6.0
5.2
4.9
4.9
6.0
5.6
5.0
3.8
4.0
5.0
2.6
2.7
3.0
1.9
4.0
2.0
1.0
3.0
-
Source: CSO, Angel Research
Source: MOSPI, Angel Research
Exhibit 3: Monthly CPI inflation trends
Exhibit 4: Manufacturing and services PMI
56.0
Mfg. PMI
Services PMI
(%)
7.0
54.0
6.1
5.8
5.8
6.0
52.0
5.1
5.0
4.3
4.2
50.0
3.9
3.6
3.7
4.0
3.4
3.2
3.0
48.0
3.0
46.0
2.0
44.0
1.0
42.0
-
Source: Market, Angel Research; Note: Level above 50 indicates expansion
Source: MOSPI, Angel Research
Exhibit 5: Exports and imports growth trends
Exhibit 6: Key policy rates
(%)
Repo rate
Reverse Repo rate
CRR
7.00
6.50
6.00
5.50
5.00
4.50
4.00
3.50
3.00
Source: Bloomberg, Angel Research
Source: RBI, Angel Research
Market Outlook
May 19, 2017
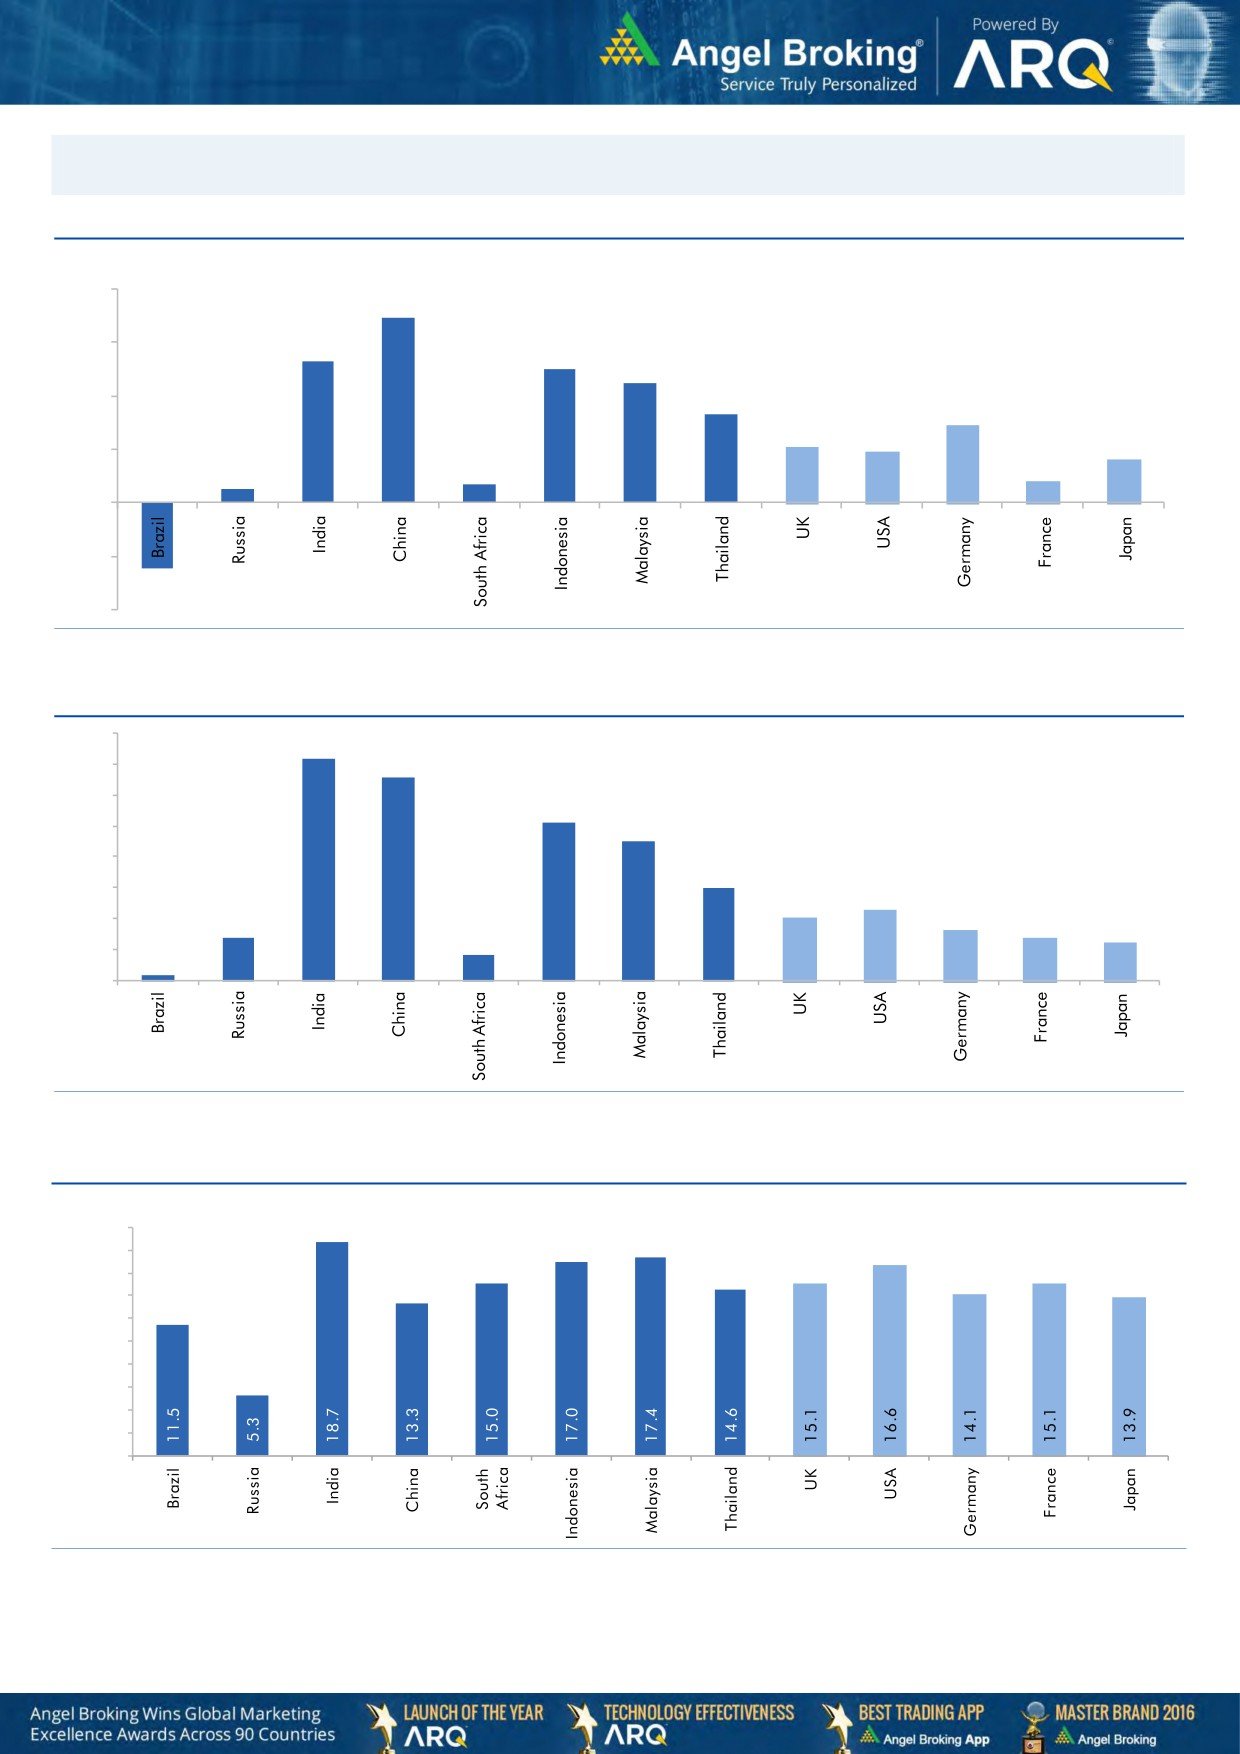
Global watch
Exhibit 1: Latest quarterly GDP Growth (%, yoy) across select developing and developed countries
(%)
8.0
6.9
6.0
5.3
5.0
0.7
4.5
4.0
3.3
2.9
2.1
1.9
0.5
2.0
1.6
0.8
-
(2.0)
(2.5)
(4.0)
Source: Bloomberg, Angel Research
Exhibit 2: 2016 GDP Growth projection by IMF (%, yoy) across select developing and developed countries
(%)
7.2
6.6
7.0
6.0
5.1
5.0
4.5
4.0
3.0
3.0
2.3
2.0
1.4
1.6
2.0
1.4
1.2
0.2
0.8
1.0
-
Source: IMF, Angel Research
Exhibit 3: One year forward P-E ratio across select developing and developed countries
(x)
20.0
18.0
16.0
14.0
12.0
10.0
8.0
6.0
4.0
2.0
-
Source: IMF, Angel Research
Market Outlook
May 19, 2017
Exhibit 4: Relative performance of indices across globe
Returns (%)
Country
Name of index
Closing price
1M
3M
1YR
Brazil
Bovespa
61,597
(2.0)
(6.8)
18.9
Russia
Micex
1,968
1.2
(9.0)
4.0
India
Nifty
9,429
3.2
7.2
20.7
China
Shanghai Composite
3,090
(3.3)
(3.8)
9.1
South Africa
Top 40
47,769
2.2
4.4
3.3
Mexico
Mexbol
48,322
(1.4)
1.4
7.3
Indonesia
LQ45
941
0.7
5.1
14.8
Malaysia
KLCI
1,767
2.1
3.4
7.5
Thailand
SET 50
981
(2.8)
(1.0)
11.1
USA
Dow Jones
20,663
0.7
0.2
18.5
UK
FTSE
7,436
1.5
2.3
20.8
Japan
Nikkei
19,554
6.1
0.5
17.9
Germany
DAX
12,590
4.0
7.0
23.4
France
CAC
5,290
4.3
8.0
17.2
Source: Bloomberg, Angel Research
Stock Watch
May 19, 2017
Company Name
Reco
CMP
Target
Mkt Cap
Sales ( Čcr )
OPM(%)
EPS (Č)
PER(x)
P/BV(x)
RoE(%)
EV/Sales(x)
(Č)
Price ( Č)
( Č cr )
FY17E FY18E
FY17E
FY18E
FY17E
FY18E
FY17E
FY18E
FY17E
FY18E
FY17E
FY18E
FY17E
FY18E
Agri / Agri Chemical
Rallis
Neutral
238
-
4,626
1,937
2,164
13.3
14.3
9.0
11.0
26.4
21.6
4.6
4.0
18.4
19.8
2.4
2.1
United Phosphorus
Neutral
816
-
41,474
15,176
17,604
18.5
18.5
37.4
44.6
21.8
18.3
4.3
3.5
21.4
21.2
2.8
2.4
Auto & Auto Ancillary
Ashok Leyland
Buy
86
111
24,588
20,021
21,915
11.6
11.9
4.5
5.3
19.2
16.2
3.9
3.5
20.6
21.5
1.2
1.0
Bajaj Auto
Neutral
2,974
-
86,053
25,093
27,891
19.5
19.2
143.9
162.5
20.7
18.3
5.8
5.0
30.3
29.4
3.2
2.8
Bharat Forge
Neutral
1,055
-
24,559
7,726
8,713
20.5
21.2
35.3
42.7
29.9
24.7
5.5
5.0
18.9
20.1
3.2
2.8
Eicher Motors
Neutral
28,357
-
77,161
16,583
20,447
17.5
18.0
598.0
745.2
47.4
38.1
16.2
12.3
41.2
38.3
4.5
3.6
Gabriel India
Neutral
131
-
1,875
1,544
1,715
9.0
9.3
5.4
6.3
24.2
20.7
4.6
4.0
18.9
19.5
1.2
1.0
Hero Motocorp
Neutral
3,596
-
71,813
28,083
30,096
15.3
15.7
171.8
187.0
20.9
19.2
7.3
6.1
30.1
27.9
2.4
2.2
Jamna Auto Industries Neutral
233
-
1,858
1,486
1,620
9.8
9.9
15.0
17.2
15.5
13.6
3.4
2.9
21.8
21.3
1.3
1.2
L G Balakrishnan & Bros Neutral
689
-
1,082
1,302
1,432
11.6
11.9
43.7
53.0
15.8
13.0
2.2
2.0
13.8
14.2
0.9
0.8
Mahindra and Mahindra Neutral
1,351
-
83,928
46,534
53,077
11.6
11.7
67.3
78.1
20.1
17.3
3.3
2.9
15.4
15.8
1.8
1.5
Maruti
Neutral
6,838
-
206,565
67,822
83,288
16.0
16.4
253.8
312.4
26.9
21.9
6.2
5.0
23.0
22.9
2.7
2.1
Minda Industries
Neutral
545
-
4,714
2,728
3,042
9.0
9.1
68.2
86.2
8.0
6.3
1.8
1.4
23.8
24.3
1.8
1.6
Motherson Sumi
Neutral
408
-
57,252
45,896
53,687
7.8
8.3
13.0
16.1
31.3
25.3
10.1
8.0
34.7
35.4
1.3
1.1
Rane Brake Lining
Neutral
1,037
-
820
511
562
11.3
11.5
28.1
30.9
36.9
33.5
5.6
5.1
15.3
15.0
1.7
1.6
Setco Automotive
Neutral
40
-
538
741
837
13.0
13.0
15.2
17.0
2.7
2.4
0.4
0.4
15.8
16.3
1.1
1.0
Tata Motors
Neutral
438
-
126,524
300,209
338,549
8.9
8.4
42.7
54.3
10.3
8.1
1.6
1.4
15.6
17.2
0.5
0.5
TVS Motor
Neutral
530
-
25,163
13,390
15,948
6.9
7.1
12.8
16.5
41.5
32.0
10.3
8.2
26.3
27.2
1.9
1.6
Amara Raja Batteries
Accumulate
913
1,009
15,588
5,305
6,100
16.0
16.3
28.4
34.0
32.1
26.8
6.2
5.2
19.3
19.3
2.9
2.6
Exide Industries
Neutral
239
-
20,311
7,439
8,307
15.0
15.0
8.1
9.3
29.5
25.7
4.1
3.7
14.3
16.7
2.3
2.1
Apollo Tyres
Neutral
233
-
11,853
12,877
14,504
14.3
13.9
21.4
23.0
10.9
10.1
1.7
1.5
16.4
15.2
1.1
1.0
Ceat
Neutral
1,845
-
7,463
7,524
8,624
13.0
12.7
131.1
144.3
14.1
12.8
2.6
2.2
19.8
18.6
1.1
0.9
JK Tyres
Neutral
175
-
3,964
7,455
8,056
15.0
15.0
21.8
24.5
8.0
7.1
1.7
1.4
22.8
21.3
0.7
0.6
Swaraj Engines
Neutral
1,850
-
2,298
660
810
15.2
16.4
54.5
72.8
34.0
25.4
10.6
9.6
31.5
39.2
3.3
2.7
Subros
Neutral
245
-
1,470
1,488
1,681
11.7
11.9
6.4
7.2
38.3
34.2
4.0
3.7
10.8
11.4
1.2
1.1
Indag Rubber
Neutral
215
-
564
286
326
19.8
16.8
11.7
13.3
18.4
16.1
3.1
2.9
17.8
17.1
1.6
1.4
Capital Goods
ACE
Neutral
65
-
639
709
814
4.1
4.6
1.4
2.1
46.1
30.8
1.9
1.8
4.4
6.0
1.1
0.9
BEML
Neutral
1,344
-
5,596
3,451
4,055
6.3
9.2
31.4
57.9
42.8
23.2
2.6
2.3
6.3
10.9
1.7
1.5
Bharat Electronics
Neutral
175
-
39,077
8,137
9,169
16.8
17.2
58.7
62.5
3.0
2.8
0.5
0.4
44.6
46.3
3.8
3.4
Stock Watch
May 19, 2017
Company Name
Reco
CMP
Target
Mkt Cap
Sales ( Čcr )
OPM(%)
EPS (Č)
PER(x)
P/BV(x)
RoE(%)
EV/Sales(x)
(Č)
Price ( Č)
( Č cr )
FY17E
FY18E
FY17E
FY18E
FY17E
FY18E
FY17E
FY18E
FY17E
FY18E
FY17E
FY18E
FY17E
FY18E
Capital Goods
Voltas
Neutral
414
-
13,709
6,511
7,514
7.9
8.7
12.9
16.3
32.1
25.4
5.8
5.1
16.7
18.5
1.9
1.6
BGR Energy
Neutral
169
-
1,222
16,567
33,848
6.0
5.6
7.8
5.9
21.7
28.7
1.2
1.2
4.7
4.2
0.2
0.1
BHEL
Neutral
165
-
40,288
28,797
34,742
-
2.8
2.3
6.9
71.6
23.9
1.2
1.2
1.3
4.8
1.1
0.8
Blue Star
Buy
648
760
6,198
4,283
5,077
5.9
7.3
14.9
22.1
43.6
29.3
8.5
7.1
20.4
26.4
1.5
1.3
CG Power and Industrial
Neutral
90
-
5,653
5,777
6,120
5.9
7.0
3.3
4.5
27.3
20.0
1.2
1.1
4.4
5.9
0.9
0.8
Solutions
Greaves Cotton
Neutral
159
-
3,872
1,755
1,881
16.8
16.9
7.8
8.5
20.3
18.7
4.1
3.8
20.6
20.9
1.9
1.7
Inox Wind
Neutral
157
-
3,487
5,605
6,267
15.7
16.4
24.8
30.0
6.3
5.2
1.8
1.3
25.9
24.4
0.7
0.5
KEC International
Neutral
236
-
6,078
9,294
10,186
7.9
8.1
9.9
11.9
23.9
19.9
3.5
3.0
15.6
16.3
0.9
0.8
KEI Industries
Accumulate
220
239
1,712
2,682
3,058
10.4
10.0
11.7
12.8
18.8
17.2
3.8
3.1
20.1
18.2
0.8
0.7
Thermax
Neutral
1,006
-
11,989
5,421
5,940
7.3
7.3
25.7
30.2
39.2
33.3
4.7
4.3
12.2
13.1
2.1
1.9
VATech Wabag
Neutral
670
-
3,657
3,136
3,845
8.9
9.1
26.0
35.9
25.8
18.7
3.2
2.8
13.4
15.9
1.1
0.9
Cement
ACC
Neutral
1,670
-
31,369
11,225
13,172
13.2
16.9
44.5
75.5
37.5
22.1
3.6
3.3
11.2
14.2
2.8
2.4
Ambuja Cements
Neutral
252
-
49,969
9,350
10,979
18.2
22.5
5.8
9.5
43.4
26.5
3.7
3.3
10.2
12.5
5.3
4.6
India Cements
Neutral
207
-
6,348
4,364
4,997
18.5
19.2
7.9
11.3
26.2
18.3
1.9
1.8
8.0
8.5
2.2
1.9
JK Cement
Neutral
1,102
-
7,706
4,398
5,173
15.5
17.5
31.2
55.5
35.3
19.9
4.2
3.7
12.0
15.5
2.3
1.9
J K Lakshmi Cement
Neutral
478
-
5,626
2,913
3,412
14.5
19.5
7.5
22.5
63.8
21.3
3.9
3.3
12.5
18.0
2.5
2.1
Orient Cement
Neutral
157
-
3,210
2,114
2,558
18.5
20.5
8.1
11.3
19.4
13.9
2.9
2.4
9.0
14.0
2.1
1.7
UltraTech Cement
Neutral
4,350
-
119,407
25,768
30,385
21.0
23.5
111.0
160.0
39.2
27.2
5.0
4.4
13.5
15.8
4.7
3.9
Construction
ITNL
Neutral
109
-
3,582
8,946
10,017
31.0
31.6
8.1
9.1
13.4
12.0
0.5
0.5
4.2
5.0
3.7
3.5
KNR Constructions
Neutral
208
-
2,929
1,385
1,673
14.7
14.0
41.2
48.5
5.1
4.3
0.9
0.8
14.9
15.2
2.2
1.8
Larsen & Toubro
Neutral
1,722
-
160,700
111,017
124,908
11.0
11.0
61.1
66.7
28.2
25.8
3.4
3.1
13.1
12.9
2.5
2.3
Gujarat Pipavav Port
Neutral
156
-
7,517
705
788
52.2
51.7
5.0
5.6
31.1
27.8
3.1
2.8
11.2
11.2
10.3
8.7
Nagarjuna Const.
Neutral
97
-
5,404
8,842
9,775
9.1
8.8
5.3
6.4
18.3
15.2
1.5
1.3
8.2
9.1
0.8
0.7
PNC Infratech
Neutral
148
-
3,801
2,350
2,904
13.1
13.2
9.0
8.8
16.5
16.8
0.6
0.5
15.9
13.9
1.7
1.4
Simplex Infra
Neutral
412
-
2,038
6,829
7,954
10.5
10.5
31.4
37.4
13.1
11.0
1.4
1.2
9.9
13.4
0.7
0.6
Power Mech Projects
Neutral
581
-
855
1,801
2,219
12.7
14.6
72.1
113.9
8.1
5.1
1.5
1.3
16.8
11.9
0.5
0.4
Sadbhav Engineering
Neutral
326
-
5,595
3,598
4,140
10.3
10.6
9.0
11.9
36.2
27.4
3.8
3.3
9.9
11.9
1.8
1.6
NBCC
Neutral
194
-
17,478
7,428
9,549
7.9
8.6
8.2
11.0
23.7
17.7
1.2
0.9
28.2
28.7
2.1
1.5
MEP Infra
Neutral
65
-
1,059
1,877
1,943
30.6
29.8
3.0
4.2
21.7
15.5
10.5
7.1
0.6
0.6
1.9
1.8
Stock Watch
May 19, 2017
Company Name
Reco
CMP
Target
Mkt Cap
Sales ( Čcr )
OPM(%)
EPS (Č)
PER(x)
P/BV(x)
RoE(%)
EV/Sales(x)
(Č)
Price ( Č)
( Č cr )
FY17E
FY18E
FY17E
FY18E
FY17E
FY18E
FY17E
FY18E
FY17E
FY18E
FY17E
FY18E
FY17E
FY18E
Construction
SIPL
Neutral
111
-
3,908
1,036
1,252
65.5
66.2
(8.4)
(5.6)
4.2
4.7
(22.8)
(15.9)
12.0
10.0
Engineers India
Neutral
167
-
11,277
1,725
1,935
16.0
19.1
11.4
13.9
14.7
12.0
2.0
2.0
13.4
15.3
5.5
4.9
Financials
Axis Bank
Buy
492
580
117,875
46,932
53,575
3.5
3.4
32.4
44.6
15.2
11.0
2.0
1.7
13.6
16.5
-
-
Bank of Baroda
Neutral
188
-
43,261
19,980
23,178
1.8
1.8
11.5
17.3
16.3
10.9
1.9
1.5
8.3
10.1
-
-
Canara Bank
Neutral
368
-
21,989
15,225
16,836
1.8
1.8
14.5
28.0
25.4
13.2
1.8
1.4
5.8
8.5
-
-
Can Fin Homes
Neutral
2,671
-
7,111
420
526
3.5
3.5
86.5
107.8
30.9
24.8
6.6
5.4
23.6
24.1
-
-
Cholamandalam Inv. &
Buy
1,035
1,230
16,176
2,012
2,317
6.3
6.3
42.7
53.6
24.2
19.3
3.8
3.3
16.9
18.3
-
-
Fin. Co.
Dewan Housing Finance Buy
418
520
13,088
2,225
2,688
2.9
2.9
29.7
34.6
14.1
12.1
2.3
1.5
16.1
14.8
-
-
Equitas Holdings
Buy
162
235
5,459
939
1,281
11.7
11.5
5.8
8.2
27.9
19.7
2.4
2.1
10.9
11.5
-
-
Federal Bank
Accumulate
111
125
19,165
8,259
8,995
3.0
3.0
4.3
5.6
25.9
19.9
2.2
2.0
8.5
10.1
-
-
HDFC
Neutral
1,539
-
244,527
11,475
13,450
3.4
3.4
45.3
52.5
34.0
29.3
6.6
5.8
20.2
20.5
-
-
HDFC Bank
Accumulate
1,558
1,650
399,728
46,097
55,433
4.5
4.5
58.4
68.0
26.7
22.9
4.7
3.9
18.8
18.6
-
-
ICICI Bank
Neutral
307
-
178,849
42,800
44,686
3.1
3.3
18.0
21.9
17.1
14.0
2.3
2.2
11.1
12.3
-
-
Karur Vysya Bank
Buy
116
140
7,007
5,640
6,030
3.3
3.2
8.9
10.0
13.0
11.6
1.4
1.3
11.2
11.4
-
-
Lakshmi Vilas Bank
Neutral
186
-
3,571
3,339
3,799
2.7
2.8
11.0
14.0
16.9
13.3
1.8
1.6
11.2
12.7
-
-
LIC Housing Finance
Neutral
675
-
34,047
3,712
4,293
2.6
2.5
39.0
46.0
17.3
14.7
3.3
2.8
19.9
20.1
-
-
Punjab Natl.Bank
Neutral
159
-
33,750
23,532
23,595
2.3
2.4
6.8
12.6
23.3
12.6
3.6
2.6
3.3
6.5
-
-
RBL Bank
Neutral
552
-
20,717
1,783
2,309
2.6
2.6
12.7
16.4
43.5
33.7
4.7
4.2
12.8
13.3
-
-
Repco Home Finance
Accumulate
754
825
4,716
388
457
4.5
4.2
30.0
38.0
25.1
19.8
4.2
3.5
18.0
19.2
-
-
South Ind.Bank
Neutral
26
-
4,705
6,435
7,578
2.5
2.5
2.7
3.1
9.7
8.4
1.2
1.0
10.1
11.2
-
-
St Bk of India
Neutral
303
-
245,688
88,650
98,335
2.6
2.6
13.5
18.8
22.4
16.1
2.1
1.9
7.0
8.5
-
-
Union Bank
Neutral
175
-
12,041
13,450
14,925
2.3
2.3
25.5
34.5
6.9
5.1
1.0
0.9
7.5
10.2
-
-
Yes Bank
Neutral
1,401
-
64,000
8,978
11,281
3.3
3.4
74.0
90.0
18.9
15.6
3.6
3.1
17.0
17.2
-
-
FMCG
Akzo Nobel India
Neutral
1,928
-
9,248
2,955
3,309
13.3
13.7
57.2
69.3
33.7
27.8
11.0
9.3
32.7
33.3
2.9
2.6
Asian Paints
Neutral
1,150
-
110,322
17,128
18,978
16.8
16.4
19.1
20.7
60.2
55.6
21.0
19.8
34.8
35.5
6.4
5.7
Britannia
Neutral
3,554
-
42,653
9,594
11,011
14.6
14.9
80.3
94.0
44.3
37.8
18.2
14.1
41.2
-
4.3
3.7
Colgate
Neutral
979
-
26,638
4,605
5,149
23.4
23.4
23.8
26.9
41.2
36.4
22.8
17.8
64.8
66.8
5.7
5.1
Dabur India
Accumulate
272
304
47,993
8,315
9,405
19.8
20.7
8.1
9.2
33.6
29.6
9.4
7.8
31.6
31.0
5.4
4.8
GlaxoSmith Con*
Neutral
5,302
-
22,298
4,350
4,823
21.2
21.4
179.2
196.5
29.6
27.0
7.9
6.7
27.1
26.8
4.5
4.0
Stock Watch
May 19, 2017
Company Name
Reco
CMP
Target
Mkt Cap
Sales ( Čcr )
OPM(%)
EPS (Č)
PER(x)
P/BV(x)
RoE(%)
EV/Sales(x)
(Č)
Price ( Č)
( Č cr )
FY17E FY18E
FY17E
FY18E
FY17E
FY18E
FY17E
FY18E
FY17E
FY18E
FY17E
FY18E
FY17E
FY18E
FMCG
Godrej Consumer
Neutral
1,782
-
60,690
10,235
11,428
18.4
18.6
41.1
44.2
43.4
40.3
9.6
8.1
24.9
24.8
6.0
5.3
HUL
Neutral
987
-
213,708
35,252
38,495
17.8
17.8
20.7
22.4
47.8
44.1
45.7
39.2
95.6
88.9
5.9
5.4
ITC
Neutral
278
-
337,758
40,059
44,439
38.3
39.2
9.0
10.1
31.0
27.4
8.6
7.5
27.8
27.5
7.9
7.1
Marico
Neutral
306
-
39,450
6,430
7,349
18.8
19.5
6.4
7.7
47.8
39.7
14.4
12.1
33.2
32.5
5.9
5.2
Nestle*
Neutral
6,528
-
62,937
10,073
11,807
20.7
21.5
124.8
154.2
52.3
42.3
21.5
19.3
34.8
36.7
6.1
5.1
Tata Global
Neutral
148
-
9,309
8,675
9,088
9.8
9.8
7.4
8.2
19.9
18.0
1.6
1.5
7.9
8.1
1.0
0.9
Procter & Gamble
Neutral
7,670
-
24,897
2,939
3,342
23.2
23.0
146.2
163.7
52.5
46.9
13.3
11.0
25.3
23.5
8.0
7.0
Hygiene
IT
HCL Tech^
Buy
848
1,014
121,065
46,723
52,342
22.1
20.9
60.0
62.8
14.1
13.5
3.6
3.0
25.3
22.4
2.3
2.0
Infosys
Buy
962
1,179
220,897
68,484
73,963
26.0
26.0
63.0
64.0
15.3
15.0
3.2
2.9
20.8
19.7
2.9
2.6
TCS
Neutral
2,534
-
499,326
117,966
127,403
27.5
27.6
134.3
144.5
18.9
17.5
5.6
5.2
29.8
29.7
3.9
3.6
Tech Mahindra
Buy
422
600
41,135
29,673
32,937
15.5
17.0
32.8
39.9
12.9
10.6
2.5
2.2
19.6
20.7
1.1
1.0
Wipro
Accumulate
524
570
127,362
55,421
58,536
20.3
20.3
35.1
36.5
14.9
14.4
2.6
2.2
19.2
14.6
1.7
1.5
Media
D B Corp
Neutral
368
-
6,771
2,297
2,590
27.4
28.2
21.0
23.4
17.5
15.7
4.1
3.5
23.7
23.1
2.7
2.4
HT Media
Neutral
86
-
2,007
2,693
2,991
12.6
12.9
7.9
9.0
10.9
9.6
0.9
0.9
7.8
8.3
0.3
0.2
Jagran Prakashan
Buy
187
225
6,100
2,355
2,635
28.0
28.0
10.8
12.5
17.3
14.9
3.7
3.2
21.7
21.7
2.6
2.3
Sun TV Network
Neutral
873
-
34,386
2,850
3,265
70.1
71.0
26.2
30.4
33.3
28.7
8.5
7.5
24.3
25.6
11.7
10.0
Hindustan Media
Neutral
277
-
2,030
1,016
1,138
24.3
25.2
27.3
30.1
10.1
9.2
1.9
1.7
16.2
15.8
1.3
1.1
Ventures
TV Today Network
Buy
266
344
1,586
567
645
26.7
27.0
15.4
18.1
17.3
14.7
2.6
2.2
14.9
15.2
2.4
2.0
Metals & Mining
Coal India
Neutral
277
-
171,635
84,638
94,297
21.4
22.3
24.5
27.1
11.3
10.2
4.7
4.5
42.6
46.0
1.5
1.4
Hind. Zinc
Neutral
245
-
103,647
14,252
18,465
55.9
48.3
15.8
21.5
15.5
11.4
2.5
2.2
17.0
20.7
7.3
5.6
Hindalco
Neutral
194
-
43,408
107,899
112,095
7.4
8.2
9.2
13.0
21.0
14.9
1.0
1.0
4.8
6.6
0.9
0.9
JSW Steel
Neutral
191
-
46,266
53,201
58,779
16.1
16.2
130.6
153.7
1.5
1.3
0.2
0.2
14.0
14.4
1.6
1.4
NMDC
Neutral
124
-
39,280
6,643
7,284
44.4
47.7
7.1
7.7
17.5
16.1
1.5
1.5
8.8
9.2
3.7
3.3
SAIL
Neutral
60
-
24,946
47,528
53,738
(0.7)
2.1
(1.9)
2.6
23.2
0.7
0.6
(1.6)
3.9
1.4
1.2
Vedanta
Neutral
231
-
85,923
71,744
81,944
19.2
21.7
13.4
20.1
17.3
11.5
1.5
1.3
8.4
11.3
1.6
1.3
Tata Steel
Neutral
487
-
47,279
121,374
121,856
7.2
8.4
18.6
34.3
26.2
14.2
1.6
1.5
6.1
10.1
1.0
1.0
Oil & Gas
GAIL
Neutral
405
-
68,523
56,220
65,198
9.3
10.1
27.1
33.3
15.0
12.2
1.4
1.3
9.3
10.7
1.4
1.2
ONGC
Neutral
181
-
232,217
137,222
152,563
15.0
21.8
19.5
24.1
9.3
7.5
0.8
0.8
8.5
10.1
2.0
1.8
Indian Oil Corp
Neutral
440
-
213,611
373,359
428,656
5.9
5.5
54.0
59.3
8.2
7.4
1.3
1.1
16.0
15.6
0.7
0.6
Stock Watch
May 19, 2017
Company Name
Reco
CMP
Target
Mkt Cap
Sales ( Čcr )
OPM(%)
EPS (Č)
PER(x)
P/BV(x)
RoE(%)
EV/Sales(x)
(Č)
Price ( Č)
( Č cr )
FY17E FY18E
FY17E
FY18E
FY17E
FY18E
FY17E
FY18E
FY17E
FY18E
FY17E
FY18E
FY17E
FY18E
Oil & Gas
Reliance Industries
Neutral
1,327
-
431,482
301,963
358,039
12.1
12.6
87.7
101.7
15.1
13.1
1.6
1.4
10.7
11.3
1.9
1.6
Pharmaceuticals
Alembic Pharma
Accumulate
603
648
11,371
3,101
3,966
19.7
20.5
21.4
25.5
28.2
23.7
6.0
4.9
23.0
22.8
3.6
2.7
Alkem Laboratories Ltd
Buy
1,920
2,257
22,959
6,065
7,009
18.7
20.0
80.2
92.0
24.0
20.9
5.4
4.5
22.5
21.6
3.7
3.2
Aurobindo Pharma
Buy
601
877
35,200
15,720
18,078
23.7
23.7
41.4
47.3
14.5
12.7
3.8
3.0
29.6
26.1
2.5
2.1
Aventis*
Neutral
4,137
-
9,529
2,206
2,508
16.6
16.8
128.9
139.9
32.1
29.6
5.5
4.3
21.6
23.5
4.1
3.4
Cadila Healthcare
Neutral
470
-
48,075
10,429
12,318
17.7
21.6
13.1
19.2
35.9
24.5
7.5
6.0
22.8
27.1
4.6
3.8
Cipla
Sell
559
465
44,946
15,378
18,089
15.7
16.8
19.3
24.5
29.0
22.8
3.4
3.0
12.3
13.9
3.1
2.6
Dr Reddy's
Neutral
2,678
-
44,374
14,081
15,937
16.1
18.6
72.6
105.9
36.9
25.3
3.6
3.3
9.6
13.6
3.4
3.0
Dishman Pharma
Sell
299
143
4,826
1,718
1,890
22.7
22.8
9.5
11.3
31.5
26.5
3.0
2.8
10.1
10.9
3.3
2.9
GSK Pharma*
Neutral
2,404
-
20,365
2,800
3,290
10.2
20.6
32.2
60.3
74.7
39.9
13.8
13.7
17.2
34.5
7.0
6.0
Indoco Remedies
Accumulate
211
240
1,947
1,112
1,289
16.2
18.2
11.6
16.0
18.2
13.2
2.9
2.5
17.0
20.1
1.9
1.6
Ipca labs
Buy
526
613
6,642
3,258
3,747
12.8
15.3
12.1
19.2
43.5
27.4
2.7
2.5
6.4
9.5
2.2
1.9
Lupin
Buy
1,305
1,809
58,939
15,912
18,644
26.4
26.7
58.1
69.3
22.5
18.8
4.4
3.6
21.4
20.9
3.8
3.1
Natco Pharma
Neutral
936
-
16,315
2,090
2,335
32.1
26.6
26.8
23.2
34.9
40.4
9.9
8.5
28.4
21.1
7.9
96.7
Sun Pharma
Buy
654
847
156,886
31,129
35,258
32.0
32.9
30.2
35.3
21.7
18.5
3.5
2.9
20.0
20.1
4.6
3.9
Power
Tata Power
Neutral
84
-
22,652
36,916
39,557
17.4
27.1
5.1
6.3
16.4
13.3
1.4
1.3
9.0
10.3
1.6
1.5
NTPC
Neutral
158
-
130,072
86,605
95,545
17.5
20.8
11.8
13.4
13.4
11.8
1.4
1.3
10.5
11.1
2.8
2.8
Power Grid
Accumulate
208
223
108,869
25,315
29,193
88.2
88.7
14.2
17.2
14.7
12.1
2.2
2.0
15.2
16.1
8.9
8.0
Real Estate
Prestige Estate
Neutral
232
-
8,693
4,707
5,105
25.2
26.0
10.3
13.0
22.5
17.8
1.8
1.7
10.3
10.2
3.0
2.7
MLIFE
Buy
444
522
2,278
1,152
1,300
22.7
24.6
29.9
35.8
14.8
12.4
1.1
1.0
7.6
8.6
2.7
2.3
Telecom
Bharti Airtel
Neutral
371
-
148,224
105,086
114,808
34.5
34.7
12.2
16.4
30.4
22.6
2.1
1.9
6.8
8.4
2.3
2.0
Idea Cellular
Neutral
87
-
31,353
40,133
43,731
37.2
37.1
6.4
6.5
13.6
13.4
1.1
1.1
8.2
7.6
1.8
1.5
zOthers
Abbott India
Neutral
4,205
-
8,935
3,153
3,583
14.1
14.4
152.2
182.7
27.6
23.0
135.7
115.8
25.6
26.1
2.5
2.2
Asian Granito
Accumulate
377
405
1,135
1,060
1,169
12.2
12.5
12.7
15.9
29.8
23.7
2.8
2.5
9.5
10.7
1.4
1.2
Bajaj Electricals
Buy
334
395
3,381
4,801
5,351
5.7
6.2
10.4
13.7
32.0
24.4
4.0
3.5
12.4
14.5
0.7
0.6
Banco Products (India)
Neutral
232
-
1,662
1,353
1,471
12.3
12.4
14.5
16.3
16.0
14.3
22.1
19.9
14.5
14.6
1.2
125.8
Coffee Day Enterprises
Neutral
267
-
5,490
2,964
3,260
20.5
21.2
4.7
8.0
-
33.3
3.1
2.8
5.5
8.5
2.3
2.0
Ltd
Competent Automobiles Neutral
225
-
144
1,137
1,256
3.1
2.7
28.0
23.6
8.0
9.5
43.3
39.1
14.3
11.5
0.1
0.1
Elecon Engineering
Neutral
60
-
672
1,482
1,660
13.7
14.5
3.9
5.8
15.4
10.3
3.6
3.3
7.8
10.9
0.8
0.7
Stock Watch
May 19, 2017
Company Name
Reco
CMP
Target
Mkt Cap
Sales ( Čcr )
OPM(%)
EPS (Č)
PER(x)
P/BV(x)
RoE(%)
EV/Sales(x)
(Č)
Price ( Č)
( Č cr )
FY17E
FY18E
FY17E
FY18E
FY17E
FY18E
FY17E
FY18E
FY17E
FY18E
FY17E
FY18E
FY17E
FY18E
zOthers
Finolex Cables
Neutral
541
-
8,272
2,883
3,115
12.0
12.1
14.2
18.6
38.1
29.1
20.3
17.7
15.8
14.6
2.6
2.3
Garware Wall Ropes
Neutral
790
-
1,729
863
928
15.1
15.2
36.4
39.4
21.7
20.1
3.9
3.4
17.5
15.9
1.9
1.8
Goodyear India*
Neutral
884
-
2,040
1,598
1,704
10.4
10.2
49.4
52.6
17.9
16.8
82.7
72.5
18.2
17.0
1.0
137.2
Hitachi
Neutral
1,792
-
4,874
2,081
2,433
8.8
8.9
33.4
39.9
53.7
44.9
43.3
36.1
22.1
21.4
2.3
2.0
HSIL
Neutral
331
-
2,390
2,384
2,515
15.8
16.3
15.3
19.4
21.6
17.0
21.5
18.5
7.8
9.3
1.2
1.1
Interglobe Aviation
Neutral
1,097
-
39,653
21,122
26,005
14.5
27.6
110.7
132.1
9.9
8.3
59.3
42.4
168.5
201.1
1.9
1.5
Jyothy Laboratories
Neutral
378
-
6,870
1,440
2,052
11.5
13.0
8.5
10.0
44.5
37.8
10.8
10.0
18.6
19.3
5.1
3.5
Kirloskar Engines India
Neutral
395
-
5,711
2,554
2,800
9.9
10.0
10.5
12.1
37.6
32.6
15.7
14.8
10.7
11.7
1.9
1.7
Ltd
Linc Pen & Plastics
Neutral
278
-
411
382
420
9.3
9.5
13.5
15.7
20.6
17.7
3.5
3.1
17.1
17.3
1.1
1.0
M M Forgings
Neutral
627
-
757
546
608
20.4
20.7
41.3
48.7
15.2
12.9
85.9
76.0
16.6
17.0
1.2
1.1
Manpasand Bever.
Neutral
795
-
4,550
836
1,087
19.6
19.4
16.9
23.8
47.1
33.4
5.6
4.9
12.0
14.8
5.2
3.9
Mirza International
Neutral
143
-
1,719
963
1,069
17.2
18.0
6.1
7.5
23.3
19.0
3.6
3.0
15.0
15.7
2.0
1.8
MT Educare
Neutral
70
-
277
366
417
17.7
18.2
9.4
10.8
7.4
6.4
1.7
1.4
22.2
22.3
0.7
0.6
Narayana Hrudaya
Neutral
300
-
6,126
1,873
2,166
11.5
11.7
2.6
4.0
113.3
75.6
7.0
6.3
6.1
8.3
3.4
2.9
Navkar Corporation
Accumulate
231
265
3,293
369
561
42.9
42.3
6.9
11.5
33.4
20.1
2.4
2.1
7.4
10.5
9.9
6.5
Navneet Education
Neutral
162
-
3,794
1,062
1,147
24.0
24.0
6.1
6.6
26.7
24.5
5.5
4.9
20.6
19.8
3.7
3.4
Nilkamal
Neutral
1,998
-
2,982
1,995
2,165
10.7
10.4
69.8
80.6
28.6
24.8
114.2
99.2
16.6
16.5
1.5
1.3
Page Industries
Neutral
14,622
-
16,309
2,450
3,124
20.1
17.6
299.0
310.0
48.9
47.2
325.7
248.6
47.1
87.5
6.7
5.3
Parag Milk Foods
Neutral
242
-
2,031
1,919
2,231
9.3
9.6
9.5
12.9
25.6
18.7
4.0
3.3
15.5
17.5
1.2
1.0
Quick Heal
Neutral
224
-
1,570
408
495
27.3
27.0
7.7
8.8
28.9
25.5
2.7
2.7
9.3
10.6
3.0
2.5
Radico Khaitan
Accumulate
129
147
1,714
1,667
1,824
13.0
13.2
6.7
8.2
19.4
15.7
1.8
1.6
9.0
10.2
1.4
1.3
Relaxo Footwears
Neutral
453
-
5,446
2,085
2,469
9.2
8.2
7.6
8.0
60.0
57.0
23.3
19.9
17.9
18.8
2.7
2.3
S H Kelkar & Co.
Neutral
284
-
4,109
1,036
1,160
15.1
15.0
6.1
7.2
46.5
39.6
5.0
4.6
10.7
11.5
3.8
3.4
Siyaram Silk Mills
Accumulate
1,779
1,872
1,667
1,652
1,857
11.6
11.7
92.4
110.1
19.2
16.2
2.8
2.5
14.7
15.2
1.2
1.1
Styrolution ABS India*
Neutral
768
-
1,351
1,440
1,537
9.2
9.0
40.6
42.6
18.9
18.0
48.3
43.9
12.3
11.6
0.9
0.8
Surya Roshni
Neutral
280
-
1,229
3,342
3,625
7.8
7.5
17.3
19.8
16.2
14.2
30.8
24.7
10.5
10.8
0.6
0.6
Team Lease Serv.
Neutral
1,205
-
2,060
3,229
4,001
1.5
1.8
22.8
32.8
52.9
36.7
5.7
4.9
10.7
13.4
0.5
0.4
The Byke Hospitality
Neutral
195
-
781
287
384
20.5
20.5
7.6
10.7
25.6
18.2
5.4
4.3
20.7
23.5
2.7
2.0
Transport Corporation of
Neutral
260
-
1,991
2,671
2,911
8.5
8.8
13.9
15.7
18.8
16.6
2.6
2.3
13.7
13.8
0.9
0.8
India
Stock Watch
May 19, 2017
Company Name
Reco
CMP
Target Mkt Cap
Sales ( Čcr )
OPM(%)
EPS (Č)
PER(x)
P/BV(x)
RoE(%)
EV/Sales(x)
(Č)
Price ( Č)
( Č cr )
FY17E FY18E FY17E FY18E FY17E FY18E FY17E FY18E FY17E FY18E FY17E FY18E FY17E FY18E
zOthers
TVS Srichakra
Neutral
4,033
-
3,088
2,304
2,614
13.7
13.8
231.1
266.6
17.5
15.1
453.2
356.8
33.9
29.3
1.3
1.2
UFO Moviez
Neutral
427
-
1,178
619
685
33.2
33.4
30.0
34.9
14.3
12.2
2.0
1.7
13.8
13.9
1.6
1.3
Visaka Industries
Neutral
367
-
582
1,051
1,138
10.3
10.4
21.0
23.1
17.5
15.9
47.0
44.0
9.0
9.2
0.8
0.8
VRL Logistics
Neutral
340
-
3,103
1,902
2,119
16.7
16.6
14.6
16.8
23.3
20.2
5.1
4.5
21.9
22.2
1.7
1.5
VIP Industries
Accumulate
194
218
2,735
1,270
1,450
10.4
10.4
5.6
6.5
34.6
29.8
7.2
6.2
20.7
21.1
2.2
1.9
Navin Fluorine
Buy
2,994
3,650
2,932
789
945
21.1
22.4
120.1
143.4
24.9
20.9
4.0
3.5
17.8
18.5
3.7
3.0
Source: Company, Angel Research; Note: *December year end; #September year end; &October year end; Price as on May 18, 2017
Market Outlook
May 19, 2017
Research Team Tel: 022 - 39357800
DISCLAIMER
Angel Broking Private Limited (hereinafter referred to as “Angel”) is a registered Member of National Stock Exchange of India
Limited,Bombay Stock Exchange Limited and Metropolitan Stock Exchange Limited. It is also registered as a Depository Participant with
CDSL and Portfolio Manager with SEBI. It also has registration with AMFI as a Mutual Fund Distributor. Angel Broking Private Limited is a
registered entity with SEBI for Research Analyst in terms of SEBI (Research Analyst) Regulations, 2014 vide registration number
INH000000164. Angel or its associates has not been debarred/ suspended by SEBI or any other regulatory authority for accessing
/dealing in securities Market. Angel or its associates/analyst has not received any compensation / managed or
co-managed public offering of securities of the company covered by Analyst during the past twelve months.
This document is solely for the personal information of the recipient, and must not be singularly used as the basis of any investment
decision. Nothing in this document should be construed as investment or financial advice. Each recipient of this document should make
such investigations as they deem necessary to arrive at an independent evaluation of an investment in the securities of the companies
referred to in this document (including the merits and risks involved), and should consult their own advisors to determine the merits and
risks of such an investment.
Reports based on technical and derivative analysis center on studying charts of a stock's price movement, outstanding positions and
trading volume, as opposed to focusing on a company's fundamentals and, as such, may not match with a report on a company's
fundamentals. Investors are advised to refer the Fundamental and Technical Research Reports available on our website to evaluate the
contrary view, if any.
The information in this document has been printed on the basis of publicly available information, internal data and other reliable
sources believed to be true, but we do not represent that it is accurate or complete and it should not be relied on as such, as this
document is for general guidance only. Angel Broking Pvt. Limited or any of its affiliates/ group companies shall not be in any way
responsible for any loss or damage that may arise to any person from any inadvertent error in the information contained in this report.
Angel Broking Pvt. Limited has not independently verified all the information contained within this document. Accordingly, we cannot
testify, nor make any representation or warranty, express or implied, to the accuracy, contents or data contained within this document.
While Angel Broking Pvt. Limited endeavors to update on a reasonable basis the information discussed in this material, there may be
regulatory, compliance, or other reasons that prevent us from doing so.
This document is being supplied to you solely for your information, and its contents, information or data may not be reproduced,
redistributed or passed on, directly or indirectly.
Neither Angel Broking Pvt. Limited, nor its directors, employees or affiliates shall be liable for any loss or damage that may arise from
or in connection with the use of this information.